Introduction:
This is the second instalment in my climate change series and today we will be exploring the impact of what I believe to be the most likely global average temperature increase by 2100. Estimates about the current global average surface temperature vary but the range is between 1.1⁰C- 1.3⁰C in 2022 relative to a 1880-99 baseline and the impacts of a warming climate are already being felt. This blog will explore a bit of climate modelling, the climatological impacts an increase of 2.5⁰C-3⁰C will bring about, why I believe this increase to be the most likely increase by the end of the current century and I’ll finished off with a bit of cautious optimism along with that can be done to safeguard progress.
The world we currently live in:
Climate change is perhaps the defining problem of the 21st century. Since the industrial revolution, humans have been extracting and consuming large amounts of fossil fuels for energy. This has led to an unprecedented increase in living standards, but it involved the large-scale release of carbon dioxide and other greenhouse gases into the atmosphere which have gradually increased in concentration in the atmosphere leading to a general increase in the Earth’s temperature.
The effects of this consumption are already here and they’re growing more severe every year. For instance, ocean pH has decreased by roughly 30% since the pre-industrial era and is now more acidic now than it was in the last two million years, according to the European Environment Agency. Along with this, the oceans have increased in sea level by 1.9mm annually between 1971 and 2006, and this seems to be increasing as the latest data shows an annual increase in sea level rise of about 3.7mm between 2006-2018, according to the Met Office, and there has been an estimated global glacial loss of an estimated 5,500 gigatons between 1993-2018, according to the IPCC. These are just a sample of the impacts of large-scale consumption of fossil fuels that we are currently experiencing with just a global average warming of about 1.1⁰C- 1.3⁰C, with further warming these issues will only get worse.
These climatic changes are driven by the “greenhouse effect”, which has been a known phenomenon since the 19th century, when John Tyndall discovered that carbon dioxide can absorb and hold heat, but climate change as the issue we recognise today only became prominent in the early-20th century when, in 1938, Guy Callendar connected carbon dioxide in the Earth’s atmosphere to global warming. Since then, global emissions have continued to increase and the adverse effect of this gradual build-up of emissions in the atmosphere has begun to have deleterious impacts on the climate system and human society. It is due to these impacts that there has been a focussed effort on researching the climate system and how it responds to change, particularly since the turn of the millennia.
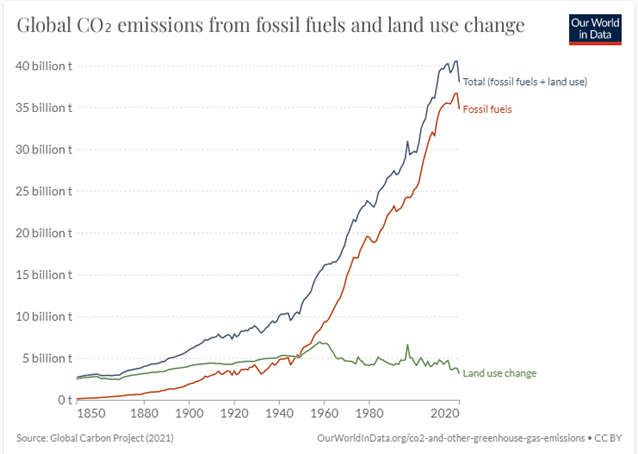
Figure 1- graph showing total carbon emissions annually from both the combustion of fossil fuels and changes in land use.
Figure 1 shows the meteoric rise in the amount of GHGs released into the atmosphere every year, the release currently sits at around 41 billion tonnes of CO2 annually (including fossil fuel consumption and land use changes).
To plot our current trajectory, I have created the below figures. Figure 2 shows the percentage change in total carbon emissions emitted every year globally relative to the previous year. As can be seen, the rate of change in generally slowing, this shows that whilst carbon emissions are still growing in total, the rate at which they are growing is slowing down, meaning that “peak carbon emissions” is likely to occur this decade if this trend continues. This measure isn’t perfect however, as the general trendline is skewed by sudden decreases in carbon production, particularly around 2008 and 2020- global financial crises and global pandemics tend to impair industry and aviation- but the general image is still viable, carbon emission growth is moving in the right direction. However, we should remain cautious as the emissions, whilst slowing down in growth, will have stabilised at an extremely high peak, meaning deep cuts will be needed to reach global agreements.
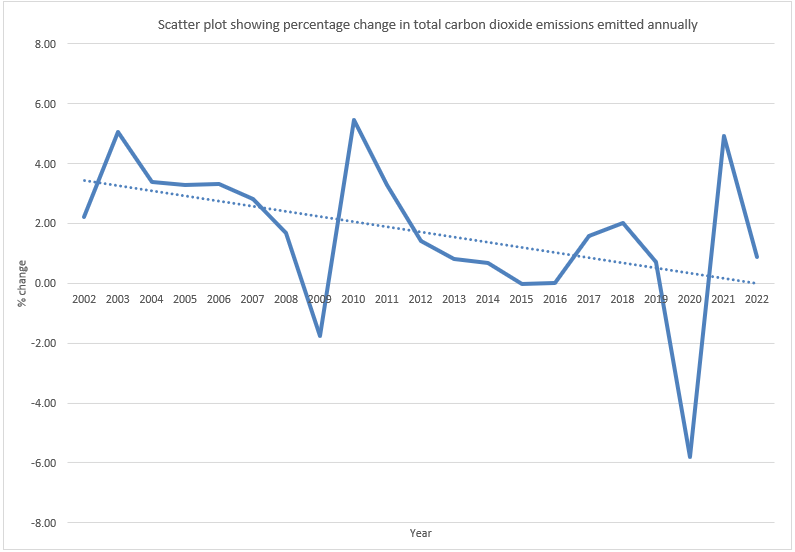
Figure 2- Scatter plot showing percentage change in total carbon dioxide emissions emitted annually.
The models and their construction:
Climate change models are principally used to guide public policy and they are often used in the IPCC reports. In 2007, the IPCC AR4 was released, after the publication of which there was a desire to update the SRES models that had been developed in the late 1990s to reflect technological advancement and socio-economic change. The IPCC AR5 was due for release in 2013 and climate modellers needed scenarios to use in their models by 2010, due to the short period of time to construct these new models, a set of “representative concentration pathways” (RCPs) were developed for climate modellers to use in the interim whilst more thorough “shared socio-economic pathways” (SSPs) were developed. Once both sets of models were developed, they would be integrated together in time for the publication of AR5 in 2013.
The RCPs were to model potential pathways to different levels of radiative forcings or change in build-up of energy in the Earth’s atmosphere. They were to focus on future GHG concentrations that could be used as inputs into future climate models. Four different radiative forcings were selected- 2.6, 4.5, 6.0 and 8.5 (W/m2). The modellers chose these specifically as they wanted to span the range of potential emissions and concentrations projected in the climate literature, but they also needed to be distinct enough from one another. However, the SSPs were not developed in time for integration for AR5 in 2013.
It wasn’t until 2017 that the SSPs were published. The SSPs combine the potential emissions changes with a range of different socio-economic factors to develop 5 storylines- factors including economic, population growth and rate of technological change. The SSPs were used in the IPCC sixth assessment report, which concluded in 2023, but did not comment on the likelihood of the scenarios.
| SSP | Scenario | Estimated warming (2041-2060) | Estimated warming (2081-2100) | Very likely range in ⁰C (2081-2100) |
| SSP1- 1.9 | Very low GHG emissions: CO2 emissions cut to net zero around 2050 | 1.6⁰C | 1.4⁰C | 1.0⁰C -1.8⁰C |
| SSP1- 2.6 | Low GHG emissions: CO2 emissions cut to net zero around 2075 | 1.7⁰C | 1.8⁰C | 1.3⁰C -2.4⁰C |
| SSP2- 4.5 | Intermediate GHG emissions: CO2 emissions around current levels until 2050, then falling but not reaching net zero by 2100. | 2.0⁰C | 2.7⁰C | 2.1⁰C -3.5⁰C |
| SSP3- 7.0 | High GHG emissions: CO2 emissions double by 2100 | 2.1⁰C | 3.6⁰C | 2.8⁰C -4.6⁰C |
| SSP4- 8.5 | Very high HGH emissions: CO2 emissions triple by 2075 | 2.4⁰C | 4.4⁰C | 3.3⁰C -5.7⁰C |
Table 1- showing various climate scenarios depending on growth of carbon emissions up until 2100.
The table above shows the range of SSP climate projections that featured in the IPCC AR6, which concluded in 2023.
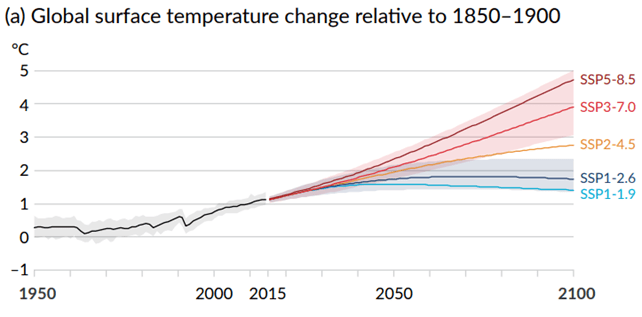
Figure 3- Graph showing several different SSPs (Shared Socioeconomic Pathways) of how temperature may increase over the course of this century.
As can be seen in figure 3, an end-of-century temperature increase of ~3⁰C tracks with SSP2-4.5. Figure 4 shows how emissions may evolve over the 21st century to produce such temperature increases.
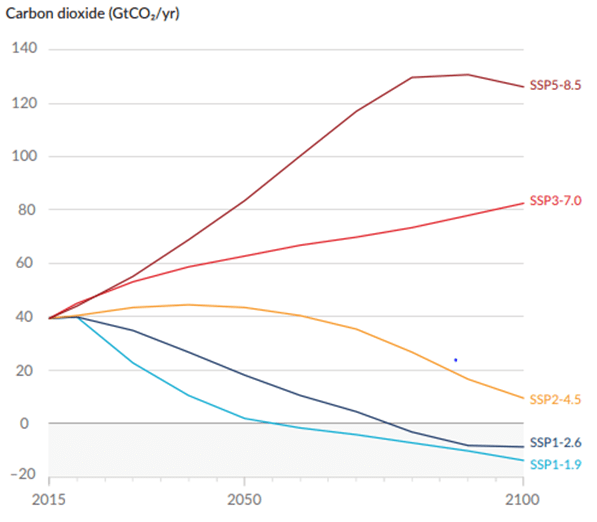
Figure 4- Graph showing the required carbon emissions needed to achieve the predicted temperatures shown in figure 1.
RCP8.5- a climate of controversy:
These models are not cast in gold, and many of them have been criticised by climate scientists, the most notable example of such controversy is RCP8.5, which models an average increase in global temperatures of roughly 5⁰C. This often referred to as a “business-as-usual” scenario. This has led many people to believe that a 5⁰C increase is a likely outcome without drastic emissions cuts driven by an over-arching climate policy. I believe this is a result of the confusion surrounding the history of the development of the RCPs and their subsequent lack of integration with the SSPs. This is not to say that a 5⁰C increase in average global surface temperatures is not possible but to suggest that it is a likely outcome, or a “business-as-usual” scenario is misleading.
Previous modelling attempts (SRES and IS92, for example) had specifically focussed upon “no climate policy” scenarios, where society is modelled to develop in different ways but there is no over-arching climate policy to reduce emissions. Future and existing climate agreements are not modelled. However, with the development of the RCPs, only RCP8.5 was created as a “baseline” scenario that included no policy-driven mitigation. Detlef van Vuuren et al, 2011, suggest that RCP8.5 should be seen as a “high emission scenario”. This suggests that the RCP8.5 was not intended to be portrayed as a likely “business-as-usual” no-policy outcome. Detlef van Vuuren et al, 2011, compare the RCP8.5 modelling with projections seen in the published literature.
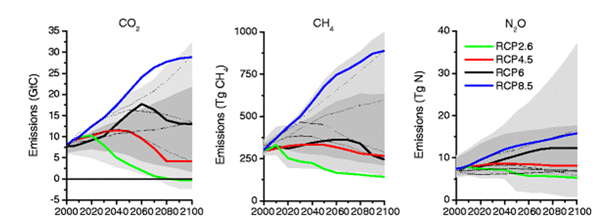
Figure 5- Detlef van Vuuren et all, 2011- line graph showing RCP8.5 projections against published literature projections. Dark grey shows 90th percentile and light grey shows 98th percentile.
The CO2 emissions projected in RCP8.5 are above the 90th percentile of all the published scenarios. RCP8.5 reflects the highest available emissions projections of the no-policy baselines scenarios. This is not an impossible future but it’s by no means a likely scenario. Furthermore, most of the other no-policy baseline projections resulted in lower emissions.
As to why RCP8.5 came to be known as a standard “business-as-usual” scenario stems from the history of the climate modelling. In a paper covering the RCP8.5, Dr Keywan Riahi described RCP8.5 as a “high emission business as usual scenario” and hence the “business-as-usual” description stuck. Couple this with the fact that, as previously mentioned, the RCP8.5 model was the only RCP projection that had no climate policy included, it can be simple to see how this misunderstanding came to be so pervasive in the climate modelling community.
Where does this leave us? It tells us that a future of radiative forcings of 8.5W/m2, whilst still being possible, is quite unlikely.
Why 2.5⁰C?
The current estimates that I find most convincing place our eventual average global temperature increase to around 2.7⁰C (2.5⁰C to 3.0⁰C) by 2100, I’m slightly more optimistic at 2.5⁰C. This put us broadly in line with SSP2- 4.5. This estimate is based upon the actions and policies currently in place and being acted upon right now.
The Paris agreement was signed in 2015 and global leaders agreed to limit warming to “well below 2⁰C above pre-industrial levels”. The agreement also stated that the preferable limit to global warming would be 1.5⁰C. As it stands in 2024, at the time of writing of this article, the chances of this agreement being fulfilled remain crushingly low at about 14%, according to the UN’s environment programme. This is because The UNEP suggests that for global warming to be limited to 1.5⁰C and 2⁰C, then GHG emissions would need to be cut by 42% and 28%, respectively, by 2030. Alternatively, the World Meteorological Organisation suggests that there is a 47% chance those global temperatures averaged out over the five-year 2024-2028 period will exceed 1.5⁰C warming compared to pre-industrial levels. So, surface temperatures being kept below 1.5⁰C is essentially impossible and below 2⁰C is highly unlikely.
So, we know that keeping temperatures below 2⁰C is unlikely but why don’t I believe that we’re heading for 4⁰C or 5⁰C of warming by 2100? These apocalyptic levels of warming are extremely unlikely according to recent modelling. For example, IEA suggests that by 2100, if stated policies are followed and implemented there is a 50% chance of global warming of 2.6⁰C. Additionally, analysis done by the climate action tracker shows a similar result of 2.7⁰C if the current policy direction is maintained for the rest of the century.
To summarise, whilst 2.6/2.7⁰C degrees of warming over pre-industrial times is far from what we wanted, the slither of optimism is that the worst-case scenarios (4⁰C and 5⁰C futures) are appearing more unlikely than they did just 15 years ago. This is coupled with the fact that carbon emissions are slowing down and are expected to peak by the middle of the 2020s, record amount of investment into a wide array of clean energy technologies ($1.7 trillion dollars in 2023 alone), successful decoupling between economic growth and carbon emissions, allowing increasing prosperity while lowering absolute emissions, even when the offshoring of emissions through trade is accounted for. This shows that whilst the fight against the destruction of the atmosphere continues, the worst-case scenarios appear to have been avoided.
The world our grandchildren will likely live in:
So far, we’ve explored a little bit of history in climate modelling and how that’s influenced public perceptions of climate change, and we’ve discussed what appears to be likely levels of warming by 2100. This section will discuss what climatological effects we are likely to see at an almost 3⁰C increase in global average surface temperatures.
Firstly, it’s important to note that global warming is not equally distributed across the surface. Previous research has shown that certain areas of the Earth will warm faster than the global average, meaning that these areas are more likely to suffer from the worst effects of climate change. These areas include the mainland US, the Arctic, the Mediterranean basin and central Brazil.
A ray of cautious optimism:
Whilst global temperatures currently are rising at an unprecedented rate and carbon emissions are stabilising at an extremely high level and as discussed in the previous section, this is having significant impacts on the climate and wider society (impacts that will only get worse as the temperatures continue to climb), there is a case for cautious optimism:
- Despite a warming Earth, the livelihoods and standards of living enjoyed by our grandchildren will be much higher than they are currently. By 2100, global GDP could reach as high as $529 trillion dollars according to the IPCC in their “high growth” scenario. This means that future generations will enjoy an unimaginable level of prosperity, which brings with it a greater ability to invest in the solutions that will be needed to continue to drive down emissions.
- The progress we have made is hard-won and I don’t believe we will slip backwards. I believe the current trajectory we are on (~2.7⁰C) is the worst-case scenario and if things change, they will most likely change for the better, meaning faster emissions reductions and adoption of new technology. Why do I think this when there is resurgent populist spirit growing around the developed world (Donald Trump recently won the American Presidency)? It’s because investment into renewable and low carbon technologies are at record high with $1.7 trillion dollars invested globally in 2023 compared to the $2.8 trillion invested in energy globally overall, out investing fossil fuels and the gap continues to widen and the electric car stock continues to grow healthily.
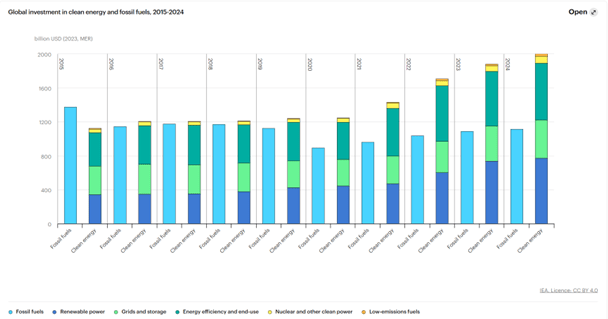
Figure 6- IEA graph showing history of clean energy and fossil fuel investment.
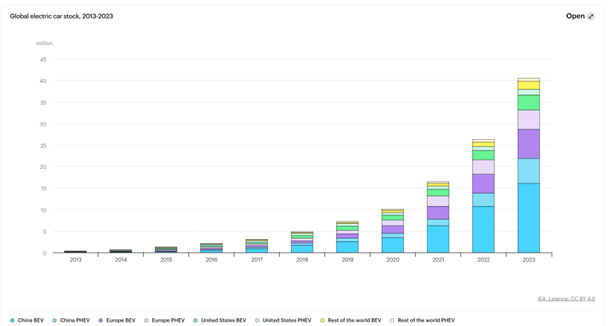
Figure 7- IEA graph showing global electric car stock.
Large investments like these allow economies of scale to develop, lowering prices while driving performance. These investments have led to the prices of green technologies becoming vastly cheaper in recent decades, much faster than was originally forecasted. Emerging technologies have become so cheap that they are now becoming cost-effective with traditional fossil fuels.
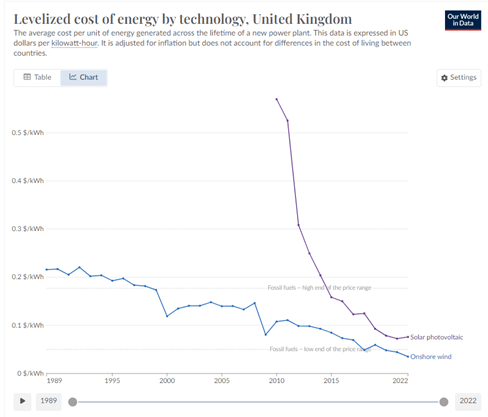
Figure 8- OurWorldInData graph showing levelised cost of energy of PV solar and onshore wind against fossil fuels in the UK.
With the emerging green technologies becoming cost-competitive with fossil fuels, it matters much less about individual leaders as these new technologies will be the logical financial choice for large sections of the economy and these investments will continue to be made (albeit at a slower rate than if leaders helped to drive investments).
- We are in a much better position than was previously forecast. In 2015, when the Paris agreement was originally signed, global carbon emissions were predicted to increase by 16% by 2023, according to the UN environmental programme, but now they are projected to increase by only 3%, with some analysis showing that emissions could peak as early as 2025. We previously discussed how RCP8.5 is an unrealistic scenario, but this wasn’t always the case, in fact the RCP8.5 projections tracked rather like cumulative emissions from 2005 to 2020. Back in the early 2000s, 5⁰C warming was a real possibility in the future as fossil fuel investments outpaced renewable energy investments and annual global carbon emissions were seeing consistent increases.
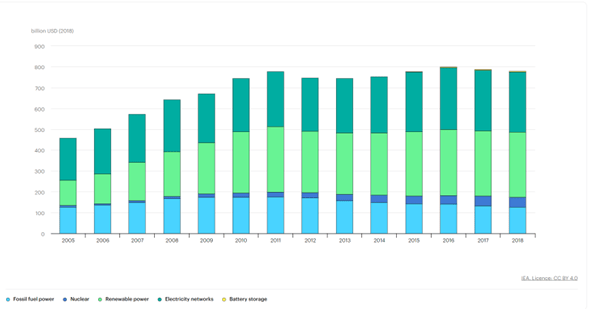
Figure 9- Graph showing investments in fossil fuels, nuclear energy, renewable energy, battery storage and electricity networks.
These are the reason why I have cautious optimism about the future. We appear to have avoided the absolute worst impacts of climate change and have started heading in the right direction and there is some reason to believe that progress will accelerate over the next few decades. However, I must stress that this is cautious optimism as progress will need to speed up as 2.7⁰C by 2100, with further warming thereafter is still not an acceptable level of warming so faster progress is going to be needed and this requires a climate-focussed electorate that will hold their national leaders to account to drive progress.
What world we are likely to impart:
One thing that is important to note and I think muddles our thinking when it comes to thinking about climate change and its impact on the planet and the organisms that live on it, is that we think of temperature increases in these arbitrary milestones like 1.5⁰C and 3⁰C increases over the pre-industrial average. This is problematic as every additional increase in average global surface temperature is negative; 1.6⁰C is worse than 1.5⁰C and 2.7⁰C is worse than 2.6⁰C.
However, since we think in these terms, this is how climate change and its impacts are discussed, in arbitrary ranges and this makes it difficult to discuss the specific impacts that 2.7⁰C of warming would have over the current warming of 1⁰C. Due to this, I will be discussing the upper range of the estimate I’ve laid out previously and will be comparing the baseline of 1⁰C warming and 3⁰C warming that we could potentially be living under by the end of the century.
Heat extremes: According to a report released by the WWF, in the current climate, the African region experiences 1-3 heatwaves per year. Under a scenario where we see a 3⁰C increase in temperatures, there could be an increase in heatwaves by a factor five by the middle of the century. This is alongside increasing risks of drought frequency and severity in areas like the Mediterranean area, Western Europe and Northern Scandinavia.
Significant water shortages: A 3⁰C increase could lead to severe water stress in much of the world. For instance, groundwater recharge is likely to fall by half of 1990 levels by 2050 in Western Australia. Groundwater recharge is the process where surface water percolates through the deeper surfaces of the Earth and recharges groundwater stores like aquifers. This is vital as many parts of the world are dependent upon groundwater for their public water needs, 2/3s of the public water supply in Western Australia come from groundwater supplies.
The threat of hitting a “tipping points”: A tipping point when spoken in climate discourse refers to a “threshold that, once crossed, cannot be reversed”. There is some ambiguity that surrounds exactly which of these tipping points will trigger and what temperature increase will trigger them. As of September 2022, 9 global core tipping elements and 7 regional impact elements are known. Below is a table that summarises the potential tipping point and the supposed temperature ranges that they are likely to occur at.
| Proposed climate tipping element | Threshold (⁰C) | ||
| Estimated | Minimum | Maximum | |
| Greenland Ice Sheet (collapse) | 1.5 | 0.8 | 3.0 |
| West Antarctic Ice Sheet (collapse) | 1.5 | 1.0 | 3.0 |
| Labrador-Irminger Seas/SPG Convection (collapse) | 1.8 | 1.1 | 3.8 |
| East Antarctic Subglacial Basins (collapse) | 3.0 | 2.0 | 6.0 |
| Arctic Winter Sea Ice (collapse) | 6.3 | 4.5 | 8.7 |
| East Antarctic Ice Sheet (collapse) | 7.5 | 5.0 | 10.0 |
| Amazon Rainforest (dieback) | 3.5 | 2.0 | 6.0 |
| Boreal Permafrost (collapse) | 4.0 | 3.0 | 6.0 |
| Atlantic Meridional Overturning Circulation (collapse) | 4.0 | 1.4 | 8.0 |
Table 2- Table showing the 9 proposed climate tipping elements and their proposed temperature trigger ranges.
As can be seen from table 2, 4 of the 9 global tipping elements are estimated to have a tipping point of ≥3⁰C. This shows that the long-term effects of climatic warming are not fully understood and depending upon the interaction of these tipping points, overall surface temperature increases could be more than currently modelled increases.
What can be done to speed up progress:
The issue with writing this article is that it has been taken the best part of a year to complete and that is quite a length of time to be writing for something like climate change where things can happen quite quickly. I had previously expressed cautious optimism and that was in 2024, as of writing this very paragraph it is 2025 and Donald Trump is the 47th President of the United States and we have seen a very tumultuous beginning to his administration with the berating of President Zelenskyy in the Oval Office, the isolation of their European and Canadian allies in favour of Putin’s regime, the beginning of what could be a bitter trade war (as of writing, Trump’s tariffs have been delayed twice). I had not originally intended to write this section, but it is due to the turbulence of the Trump administration that I feel compelled to contemplate and explore what could be done in successive administrations to speed up progress towards proper climate action.
In this paragraph I will talk specifically about the United Kingdom- what they have done so far, and we can be done further to continue to drive their GHG emissions.
The UK has done reasonably well in recent decades in decarbonising. For instance, by 2019 GHG emissions had fallen 42% relative to 1990 levels- this is due to multiple factors including the widespread de-industrialisation and the so-called “dash-to-gas” that came along with the closure of the coal mines under Thatcher’s premiership. This was combined with carbon taxes (formerly the EU ETS, which was later replaced when Britian exited the EU, and carbon price underpin- the climate change levy and carbon price support) along with subsidies for cleaner alternatives. However, much of this progress has been concentrated in electrical generation with the phasing out of coal and its replacement, initially with natural gas and then increasingly by renewable alternatives. Due to this, there are several sectors whose emissions have remained high, particularly transport and agriculture.
Carbon pricing will remain a key feature of the UK’s decarbonisation strategy- when the UK exited the EU, it modelled its new carbon pricing on the former EU ETS however this leaves holes with the tax system that can make decarbonisation less attractive. For instance, building renovations face the full VAT rate compared to new construction which are zero-rated- making building renovations less attractive.
The Climate Change Committee in 2021 recommended the below as part of the UK’s climate change strategy:
| Sector | CCC recommendation |
| Power generation | 40 GW of offshore wind capacity by 2030. |
| One new nuclear power plant operational by 2030; one further plant by 2035 | |
| Transport | No new cars and vans with an internal combustion engine sold from 2032 |
| Stabilisation of air passenger demand at 2019 levels through the 2020s | |
| Buildings | 415,000 heat pump installations per year by 2025, rising to 1.1 million installations by 2030 |
| Close to 700,000 loft insulations a year throughout the 2020s | |
| Industry | 30 TWh/year of low-carbon hydrogen by 2030 |
| 22MtCO2/year captured and stored by 2030 | |
| Agriculture | 33% reduction in food waste from 2020 by 2030 |
| 20% reduction in meat consumption from 2020 by 2030 | |
| Land use | Afforestation of 30,000 hectares per year by 2025, rising to 50,000 hectares per year by 2035 |
| Peatland restoration of 67,000 ha/year from 2025 | |
| Waste | 37% reduction in residual waste per capita from 2018 by 2030 |
| 25% increase in household recycling rates from 2018 by 2030 | |
| Greenhouse gas removals | 4.8MtCO2/year by 2030 (primarily through biogas energy with carbon capture and storage, or BECCS). |
Table 3- Table showing Climate Change Committee recommendation in 2021.
For these recommendations to be implemented a sustained investment of approximately £50 billion a year will be needed by 2030. To aid in this investment, it is important for the UK Government to provide certainty about the policy environment that these investments will be made within.
As the economy decarbonises, there are likely to be profound changes in the structure of the job market. Based off US data, it is estimated that approximately 3 million UK jobs will require some form of reskilling and a further 3 million occupations, electrical engineering for example, will be in greater demand- this will require addressing skills gaps within the workforce to prevent bottlenecks and boost productivity.
It would also likely be beneficial to harness the power of local governments, that also control important aspects of climate change policy like waste, planning and local transport, but funding cuts and intermittent support has hindered the efforts of local governments in realising their full potential on this front. Policy experts have called for better co-ordination between governance level and more predictable long-term funding.
Conclusions:
To conclude, climate change, and other environmental issues, are perhaps the defining issues facing humanity in the 21st Century. We have models of the climate that show us some potential futures that lay ahead of us, some much worse than others. To avoid these lesser futures and to ensure that humanity continues to prosper, faster progress and deeper emissions cuts need to be made now to prevent potentially apocalyptic amounts of climatic warming. This progress will be safeguarded by an electorate that takes environmental issues seriously and are steadfast in their determination to hold elected officials to account to help safeguard humanity’s future in this century and into the next!
